Case Study 03 / Analysis
Data & BI Portfolio
Three analytical builds, three different tools — because the tool should match the question, not the other way around.
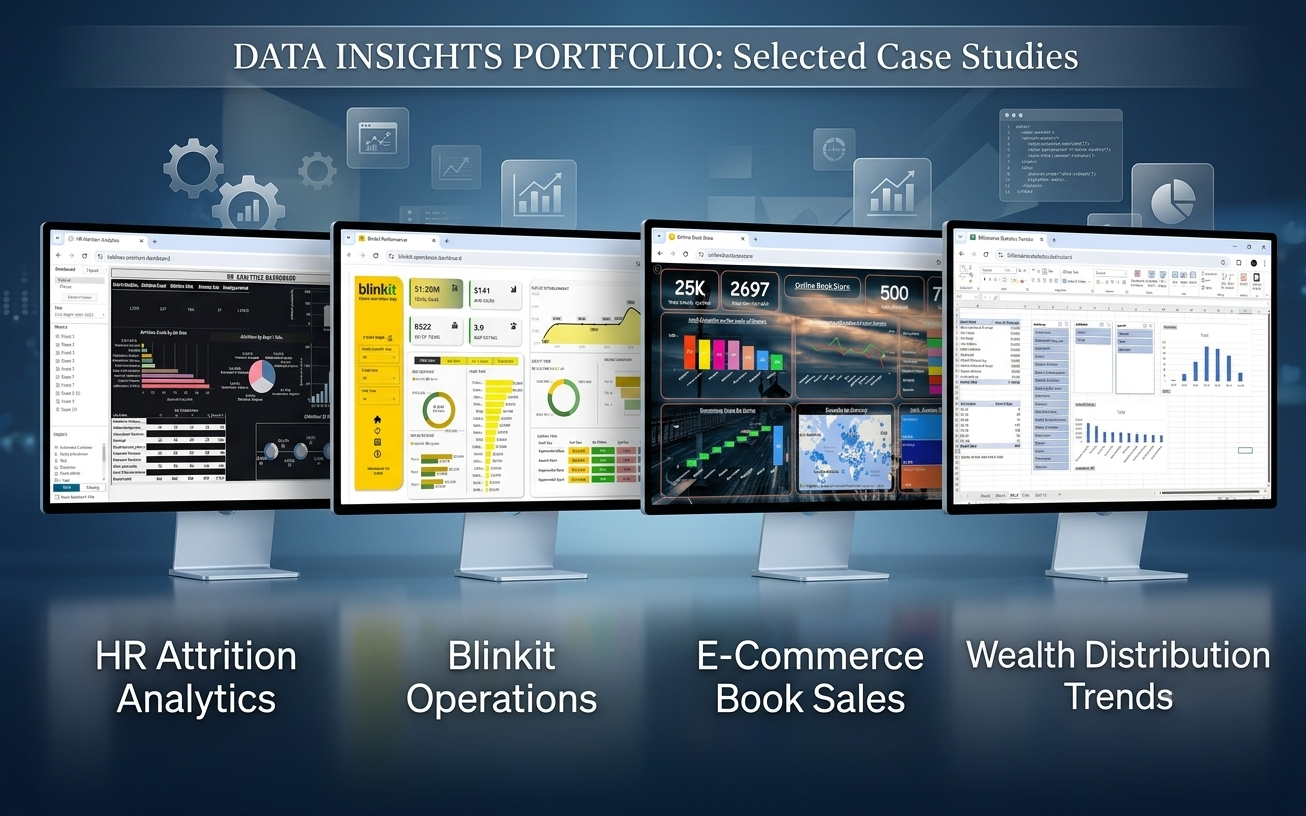
Three analytical builds, three different tools — because the tool should match the question, not the other way around.
A retail chain trialled a layout change in three stores and needed to know if it actually worked — not just whether sales went up, since sales go up and down for a hundred reasons that have nothing to do with a layout.
calculateCorrelation and calculateMagnitudeDistance — to find controls that actually tracked the trial stores' pre-trial behavior.data.table for the joins and aggregations and ggplot2 for the comparison visuals, run through setDT() before any table operation.Built HR analytics dashboards in both Power BI and Tableau — deliberately not the same dataset reshaped twice. Each uses a different underlying schema, built and reasoned through independently, because presenting them as one unified model would be dishonest about what they actually are.
R for the Quantium question, because a causal claim needs statistical rigor and a reproducible script, not a drag-and-drop chart. Power BI and Tableau for the HR dashboards, because that's stakeholder-facing work — the deliverable is a decision someone else can make without reading code.